Rosyth Dockyard – Datums and Tide Levels
< Return to 12 – 1914-1916 The Entrance Lock
Water levels – establishing a “datum”
The water level in the basin is an easy concept to explain. The basin is filled until the water is 38 feet (11.6m) deep.
But how does this compare to the sea water level outside the basin?
To understand this we need to know “the mean sea level” and the current state of the tide i.e. how high is the sea above or below mean sea level at any given time.
Mean sea level.
Ordnance survey maps show heights as contour lines or summit heights above sea level – meaning above mean sea level.
Mean sea level might seem to be a simple concept – it is the average sea level as measured over some period of time that is long enough to take account of the highest and lowest tidal conditions.
But mean sea level varies from place to place. In a North Sea estuary like the Firth of Forth the general movement of water is more restricted, so the mean sea level is higher, than at an open Atlantic Ocean waterfront.
Heights (and depths) on Ordnance survey maps are all measured relative to the Ordnance datum.
Ordnance datum
The Ordnance datum is a nation-wide level determined as the mean sea level at Newlyn in Cornwall – as determined by a series of measurements every fifteen minutes taken over a six-year period.
Ordnance Datum (Newlyn) is the datum of the land levelling system used in most of the UK, and is defined as the average value of the sea level recorded at Newlyn for the period 1915 to 1921 (6 years). However due to sea level rise since this time, the current mean sea level at Newlyn is about 0.2m above Ordnance Datum (Newlyn).
Here are two press articles from 2021 about Newlyn Pier
“Newlyn pier plays a crucial role in understanding climate change” from The Times
“The Cornish hut that gave rise to the sea level benchmark” from the BBC
You can read more details at the National Tidal and Sea Level Facility
Chart Datum is unique to each location and is usually set to be close to the lowest tide level that can occur under normal meteorological conditions. Therefore heights will almost always be positive values.
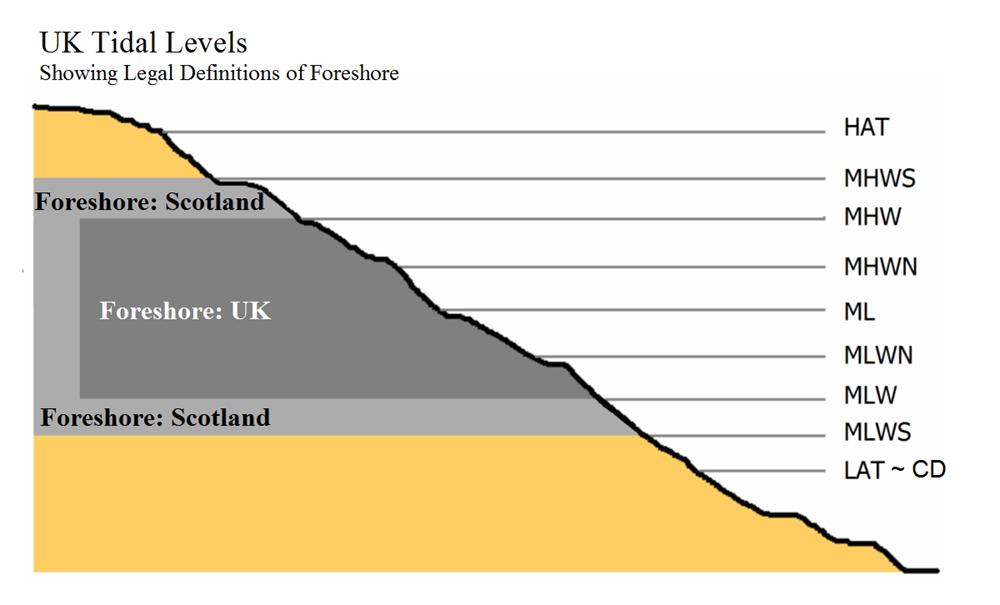
UK Tide Level Definitions

HAT – Highest astronomical tide
Highest astronomical tide (HAT) is the highest level, can be expected to occur under average meteorological conditions and under any combination of astronomical conditions.
HAT is not the most extreme level, as certain meteorological conditions can cause a higher level. The level under these circumstances is known as a ‘storm surge’
LAT – Lowest astronomical tide
Lowest astronomical tide (LAT) is the lowest level that can be expected to occur under average meteorological conditions and under any combination of astronomical conditions.
LAT is not the most extreme level, as certain meteorological conditions can cause a lower level. The level under these circumstances is known as a ‘negative surge’.
CD – Chart Datum
This is defined as LAT
MHWS – mean high water springs
The height of mean high water springs is the average throughout the year (when the average maximum declination of the moon is 23.5°) of two successive high waters during those periods of 24 hours when the range of the tide is at its greatest.
MLWS – mean low water springs
The height of the mean low water springs is the average throughout the year (when the average maximum declination of the moon is 23.5°) of two successive low waters during those periods of 24 hours when the range of the tide is at its greatest.
MHWN – mean high water neaps
The height of mean high water neaps is the average throughout the year (when the average maximum declination of the moon is 23.5°) of two successive high waters during those periods of 24 hours when the range of the tide is at its least.
MLWN – mean low water neaps
The height of the mean low water neaps is the average throughout the year (when the average maximum declination of the moon is 23.5°) of two successive low waters during those periods of 24 hours when the range of the tide is at its least.
Note: The values of MHWS, MLWS, MHWN and MLWN vary from year to year with a cycle of approximately 18.6 years.
MHW – Mean High Water, the average of MHWS and MHWN
MLW – Mean Low Water, the average of MLWS and MLWN
ML – Mean Sea Level